Features
Industries
Who we serve
Resources
Sign in
Get Started - $500/month
No commitment. No implementation fee. Unlimited users. Cancel anytime
Imagine this: A Category 4 hurricane barrels toward the Gulf Coast. Winds howl at 140 mph, flooding streets and snapping power lines like twigs. In the chaos, your utility’s storm response isn’t just about flipping switches; it’s about restoring light to hospitals, homes, and businesses before lives are put at risk.
If you miss a single key metric, you’re not just battling outages. You’re facing regulatory fines, customer outrage, and multimillion-dollar recovery costs.
In 2024 alone, the U.S. faced 27 billion-dollar weather and climate disasters. It’s a record-breaking year that pushed the power grid to its limits.
But here’s some good news. Tracking the right storm readiness metrics can turn chaos into control. These eight battle-tested indicators drawn from NERC, DOE, and FEMA frameworks define how ready your utility truly is.
Whether you’re benchmarking performance, preparing for regulatory audits, or building a proactive grid-resilience plan, these are the numbers that matter. And these are the metrics that you shouldn't be missing at any cost!
Storm readiness metrics are data-driven indicators utilities use to measure how prepared they are to withstand, respond to, and recover from severe weather events. These metrics combine operational performance, asset health, and grid reliability to help utilities act before outages escalate.
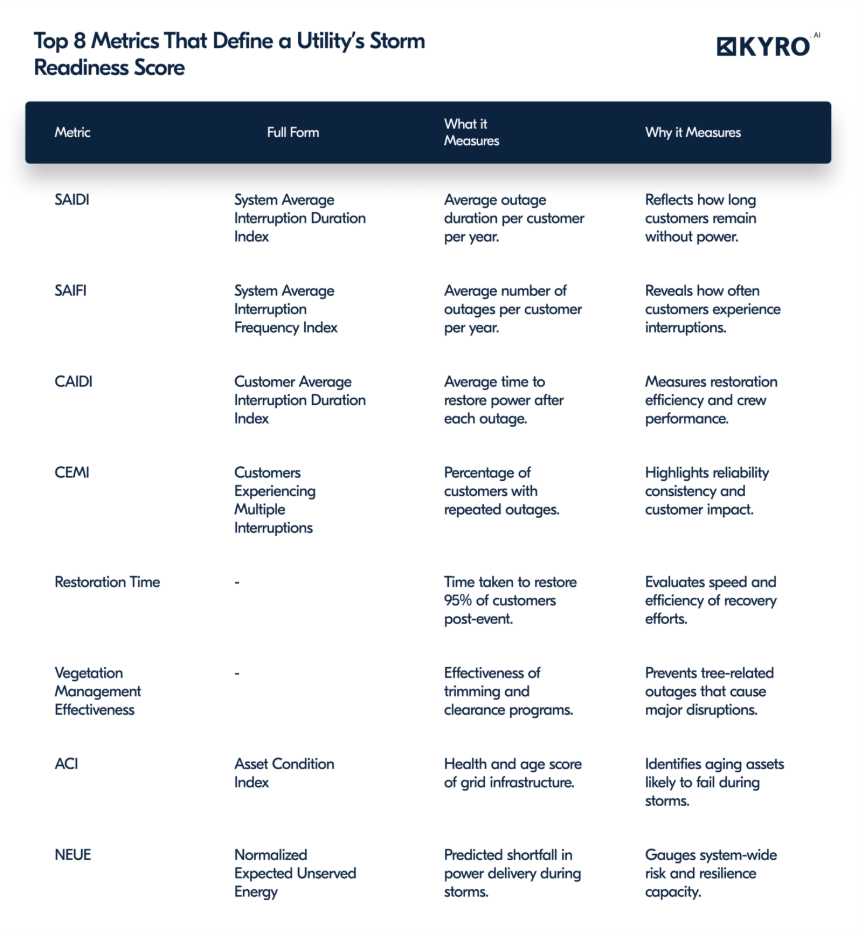
System Average Interruption Duration Index
The average total duration of power interruptions per customer each year (in minutes).
This metric reflects how long customers remain without power. Extended outages during severe weather don’t just disrupt daily life, they can quickly escalate into safety and public health emergencies.
System Average Interruption Frequency Index
How often the average customer experiences an outage in a year.
Every outage counts. Frequent interruptions expose weak points in your distribution system.
Customer Average Interruption Duration Index
The average time to restore service per outage.
Every extra hour multiplies costs and customer frustration.
Customer Estimated Minutes of Interruption
The average duration a customer experiences a power outage during major events.
Offers a granular, customer-focused view of storm impact and storm preparedness assessment. Regulators and stakeholders increasingly demand this metric for transparency and post-storm analysis.
Time to restore 95% of customers' post-events.
Delayed restoration disrupts critical services. From refrigerated meds to emergency communication networks.
How effectively you manage vegetation near lines, often measured via clearance compliance or reduction in tree-related outages.
Overgrown trees cause 25% of storm-related outages, but proactive trimming prevents 60% of failures.
What it measures:
Infrastructure health scored from 1–10 based on age, inspections, and failure history. This is a grid reliability metrics that helps assess the structures.
Why it matters:
Old assets fail first in storms, doubling repair costs.
Normalized Expected Unserved Energy
Projected energy shortfall (MWh) under extreme-event scenarios.
Shows how exposed your utility is when storms overload supply or distribution.
These eight metrics don’t exist in silos. They are the core of your system and form your utility’s storm-readiness DNA. Low SAIDI but high NEUE? You’re fast but fragile. Strong ACI but weak CEMI? You’re sturdy but impacting customers. That’s how it works!
SMS alerts go directly to field crews when a storm event triggers. You can see when each crew accepts, declines, or confirms readiness.
Digital forms simplify contractor onboarding, automatically verifying crew details, equipment lists, and certifications before storms hit.
KYRO AI’s platform matches the right crews to the right zones based on skill, proximity, and availability, cutting roster-building time significantly.
All seven-readiness metrics, right from mobilization, restoration, vegetation compliance, and more, are displayed in one unified view for faster, data-backed decision making.
As storms begin to form, KYRO AI gives utilities the clarity to act early, not react after conditions worsen.
Every storm is a test. Every minute counts. Start scoring your readiness today, before the next outage strikes.
Explore KYRO Storm Response to measure, predict, and improve your utility’s storm resilience with real-time AI insights.
Imagine this: A Category 4 hurricane barrels toward the Gulf Coast. Winds howl at 140 mph, flooding streets and snapping power lines like twigs. In the chaos, your utility’s storm response isn’t just about flipping switches; it’s about restoring light to hospitals, homes, and businesses before lives are put at risk.
If you miss a single key metric, you’re not just battling outages. You’re facing regulatory fines, customer outrage, and multimillion-dollar recovery costs.
In 2024 alone, the U.S. faced 27 billion-dollar weather and climate disasters. It’s a record-breaking year that pushed the power grid to its limits.
But here’s some good news. Tracking the right storm readiness metrics can turn chaos into control. These eight battle-tested indicators drawn from NERC, DOE, and FEMA frameworks define how ready your utility truly is.
Whether you’re benchmarking performance, preparing for regulatory audits, or building a proactive grid-resilience plan, these are the numbers that matter. And these are the metrics that you shouldn't be missing at any cost!
Storm readiness metrics are data-driven indicators utilities use to measure how prepared they are to withstand, respond to, and recover from severe weather events. These metrics combine operational performance, asset health, and grid reliability to help utilities act before outages escalate.
System Average Interruption Duration Index
The average total duration of power interruptions per customer each year (in minutes).
This metric reflects how long customers remain without power. Extended outages during severe weather don’t just disrupt daily life, they can quickly escalate into safety and public health emergencies.
System Average Interruption Frequency Index
How often the average customer experiences an outage in a year.
Every outage counts. Frequent interruptions expose weak points in your distribution system.
Customer Average Interruption Duration Index
The average time to restore service per outage.
Every extra hour multiplies costs and customer frustration.
Customer Estimated Minutes of Interruption
The average duration a customer experiences a power outage during major events.
Offers a granular, customer-focused view of storm impact and storm preparedness assessment. Regulators and stakeholders increasingly demand this metric for transparency and post-storm analysis.
Time to restore 95% of customers' post-events.
Delayed restoration disrupts critical services. From refrigerated meds to emergency communication networks.
How effectively you manage vegetation near lines, often measured via clearance compliance or reduction in tree-related outages.
Overgrown trees cause 25% of storm-related outages, but proactive trimming prevents 60% of failures.
What it measures:
Infrastructure health scored from 1–10 based on age, inspections, and failure history. This is a grid reliability metrics that helps assess the structures.
Why it matters:
Old assets fail first in storms, doubling repair costs.
Normalized Expected Unserved Energy
Projected energy shortfall (MWh) under extreme-event scenarios.
Shows how exposed your utility is when storms overload supply or distribution.
These eight metrics don’t exist in silos. They are the core of your system and form your utility’s storm-readiness DNA. Low SAIDI but high NEUE? You’re fast but fragile. Strong ACI but weak CEMI? You’re sturdy but impacting customers. That’s how it works!
SMS alerts go directly to field crews when a storm event triggers. You can see when each crew accepts, declines, or confirms readiness.
Digital forms simplify contractor onboarding, automatically verifying crew details, equipment lists, and certifications before storms hit.
KYRO AI’s platform matches the right crews to the right zones based on skill, proximity, and availability, cutting roster-building time significantly.
All seven-readiness metrics, right from mobilization, restoration, vegetation compliance, and more, are displayed in one unified view for faster, data-backed decision making.
As storms begin to form, KYRO AI gives utilities the clarity to act early, not react after conditions worsen.
Every storm is a test. Every minute counts. Start scoring your readiness today, before the next outage strikes.
Explore KYRO Storm Response to measure, predict, and improve your utility’s storm resilience with real-time AI insights.

Rabiya Farheen is a content strategist and a writer who loves turning complex ideas into clear, meaningful stories, especially in the world of utility, tech, AI, and B2B SaaS. She works closely with growing teams to create content that doesn’t just check SEO boxes, but actually helps people understand what a product does and why it matters. With a knack for research and a curiosity that never quits, Rabiya dives deep into industry trends, customer pain points, and data to craft content that feels super helpful and informative. When she’s not writing, she’s probably reading, painting, and exploring her creative side— or you'll find her hustling around for social causes, especially those that empower girls and women.
.png)
.jpg)
.jpg)