Features
Industries
Who we serve
Resources
Sign in
Get Started - $500/month
No commitment. No implementation fee. Unlimited users. Cancel anytime
.jpg)
Your TRIR tells you what already went wrong. It doesn't tell you what's about to.
The contractors and utilities that run the safest field operations don't just track injuries differently. They track different things entirely. They measure the upstream activities and conditions that predict whether an incident will happen, before the incident happens. Those are safety leading indicators, and this guide covers the eight most predictive ones for construction and utility field teams.
The defining characteristic of a leading indicator is timing.
A lagging indicator measures a safety failure after it has occurred. A recordable injury, a lost-workday case, a workers' comp claim.
A leading indicator measures an activity or condition that predicts whether that failure is coming.
The practical difference between leading vs lagging safety indicator matters enormously. When your TRIR rises, you already have injured workers. When your near-miss reporting rate drops or your corrective action close-out time rises, you have a window to intervene. That window is what separates proactive safety programs from reactive ones.
For construction and utility teams specifically, leading indicators need to reflect the reality of field operations with distributed crews, hazardous environments, rotating personnel, and work conditions that change hourly.
Generic corporate safety KPIs often miss that context entirely. The eight indicators below are selected for their predictive strength in exactly these environments, drawing from various research and OSHA's leading indicator framework.
Near-miss reporting is the single most predictive leading indicator available. Every unreported near-miss is a precursor event that didn't trigger a learning response. Organizations with high near-miss reporting rates consistently show lower recordable injury rates because the fewer hazardous events surface and get addressed before they escalate.
A declining near-miss rate is a red flag, not a green one. It usually signals that workers don't trust the reporting system, fear blame, or believe nothing will change.
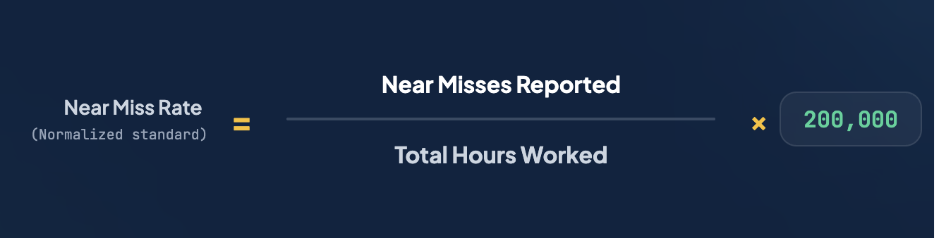
Track: Weekly
For contractors managing TRIR, near-miss volume is the upstream metric to watch. Download this guide to know the nuances of TRIR.
Safety observations, supervisors or peers formally documenting field conditions and behaviors, serve two functions:
Research consistently links observation frequency to reduced injury rates in field operations.
The quality of observations matters as much as the volume. Observations that only document compliance (everyone wearing PPE) are less valuable than those that identify at-risk conditions or behaviors with specific corrective actions attached.
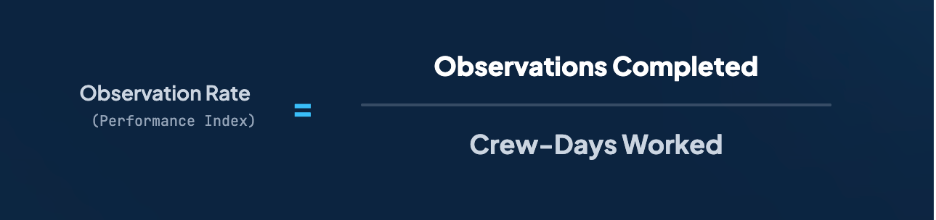
Track: weekly
ABC's 2026 Health and Safety Performance Report found that companies conducting daily toolbox talks reported lower incident rates than firms holding monthly meetings, making frequency a measurable variable.
The completion rate tracks whether pre-shift safety briefings are actually happening, documented, and tied to the specific hazards of that day's work.
For utility and storm restoration teams, toolbox talks are also an OSHA documentation requirement during restoration events. A digital record of every briefing is increasingly what separates organizations that defend investigations successfully from those that don't.
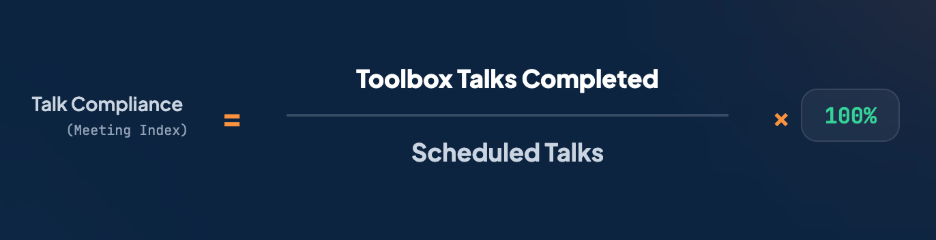
Track: Daily
See our guide on storm response safety checklists for a practical framework.
Identifying hazards is only half the job. Organizations that identify hazards but don't close corrective actions create a specific failure mode: workers observe that reported problems go unaddressed, near-miss reporting drops, and hazards persist until they produce an incident. Close-out rate measures whether the safety system is actually working after the observation is made.
A close-out rate below 80% within 30 days is a reliable warning sign that safety culture is eroding regardless of what lagging indicators currently show. KYRO AI's field safety module tracks open corrective actions automatically, flagging overdue items to supervisors in real time.
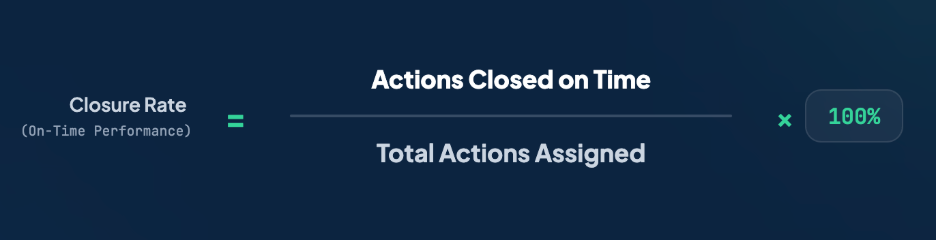
Track: Bi-weekly
Job Hazard Analysis completion before high-risk tasks is one of the most directly protective leading indicators available. For utility linework, trenching, aerial operations, and confined space entry, a completed JHA forces a structured hazard review before work begins.
Research from the Campbell Institute identifies pre-task planning as among the highest-leverage safety activities for field crews.
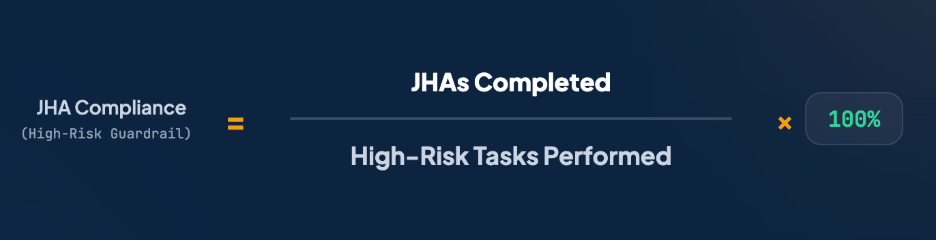
Track: Daily for high-risk tasks
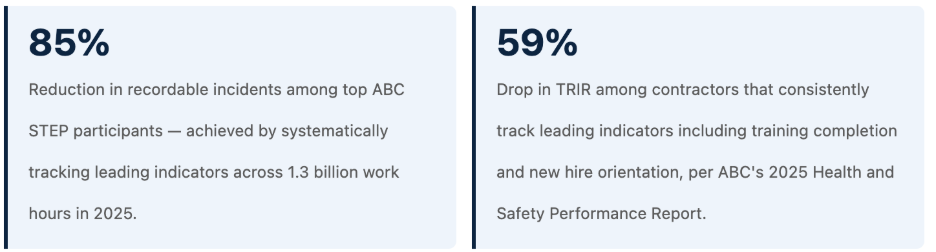
Training completion isn't just a compliance check. It's a leading indicator with direct predictive power. Tracking and reviewing activities such as safety training, new hire safety orientation, and substance abuse prevention leads to a 59% reduction in TRIR and a 60% reduction in DART rates.
For contractors managing rotating field crews, training completion tracking requires automated credential and certification tracking, not a spreadsheet. Gaps in training coverage across a 200-person deployment create liability exposure that surfaces during OSHA investigations, not before them.
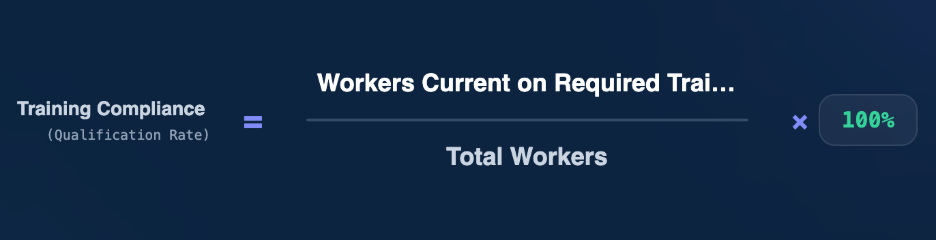
Track: Monthly + at mobilization
See how real-time field data accuracy connects to safety compliance.
Visible safety leadership is one of the strongest predictors of safety culture. And safety culture is one of the strongest predictors of incident rates. When supervisors and project managers regularly conduct documented safety walks, it signals that safety performance is monitored and valued at every level of the organization, not just on paper.
The key word is "documented." Informal walkthroughs that produce no record don't generate the leading indicator data that helps you identify patterns, benchmark performance, or defend your program during an incident investigation.
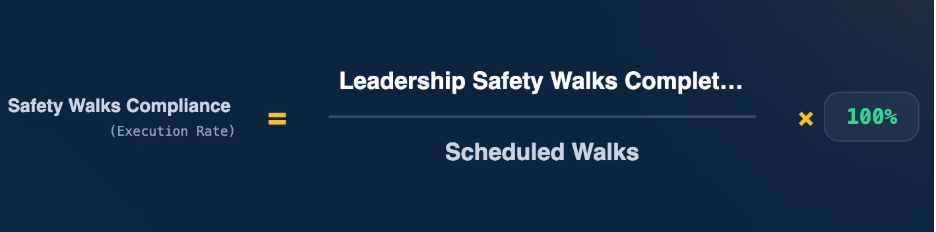
Track: Weekly
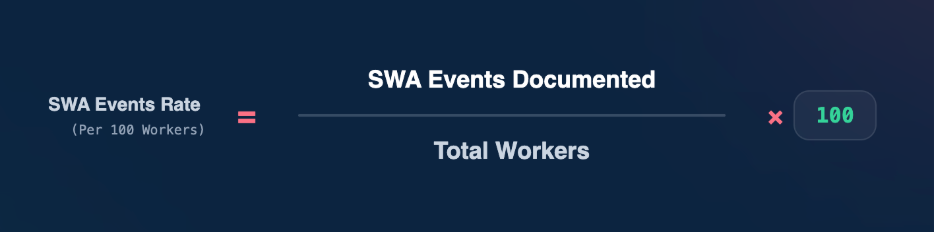
Stop-work authority (SWA) is the right of any worker to halt operations when they observe an unsafe condition. Most safety programs include SWA on paper. Far fewer measure whether it's being used, and a usage rate near zero is not a good sign. It typically means workers don't believe they can exercise SWA without consequences, which is a leading indicator of suppressed near-miss reporting and elevated incident risk.
For utility contractors under OSHA 29 CFR 1910.269, documented SWA usage is increasingly examined during incident investigations.
Track: Monthly
See our full breakdown of what OSHA actually requires during high-risk field operations.
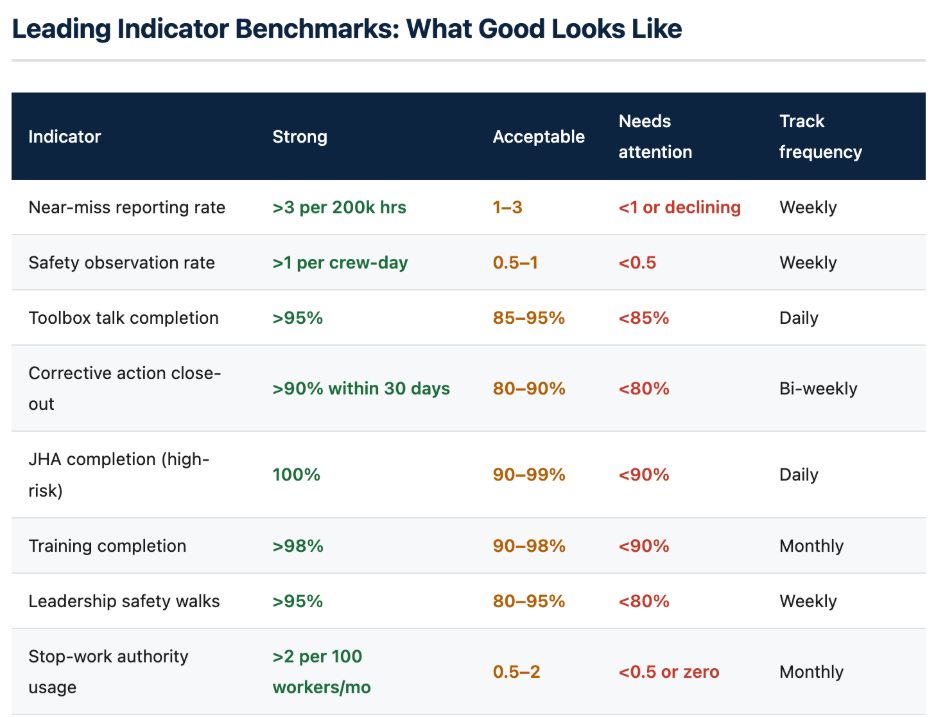
Important caveat on benchmarks: These thresholds reflect field programs across construction and utility operations. Near-miss reporting rate benchmarks are intentionally higher than many organizations currently achieve, because low reporting is the problem, not the benchmark. Use these as directional targets, not pass/fail tests.
The reason many safety programs still rely on lagging indicators isn't philosophical; it's practical. Leading indicators require data that originates in the field: completed forms, timestamped briefings, GPS-verified crew locations, digital sign-offs. When that data lives on paper, in binders, or in supervisor memory, it's unavailable until someone manually collects and compiles it, which typically happens quarterly, if at all.
Digital field capture changes the fundamental timing problem. When toolbox talks are completed through KYRO AI's field safety module, the completion rate updates in real time. When a supervisor submits a safety observation, it automatically populates the corrective action tracker. When a worker's training certification expires, the rostering system flags it before that worker is assigned to a high-risk task.
The result is a leading indicator dashboard that reflects current field conditions, not last quarter's paper audit.
For contractors managing large-scale deployments across multiple zones, this shift from quarterly reporting to real-time visibility is often the difference between identifying a safety trend in time to act and identifying it in an incident investigation report.
Proactive metrics that measure activities and conditions predictive of future incidents — near-miss rates, training completion, and inspection frequency. Unlike lagging indicators (TRIR, DART) which measure what already happened, leading indicators give safety managers early warning signals while there is still time to intervene.
Lagging indicators measure safety failures after they occur. Leading indicators measure upstream activities and conditions that predict whether failures will occur. Leading indicators give you time to act; lagging indicators confirm you didn't.
For a full breakdown, see our leading vs. lagging indicators guide.
The 8 strongest for field teams: near-miss reporting rate, safety observation frequency, toolbox talk completion, corrective action close-out rate, JHA completion, training completion, leadership safety walk frequency, and stop-work authority usage rate.
Your TRIR tells you what already went wrong. It doesn't tell you what's about to.
The contractors and utilities that run the safest field operations don't just track injuries differently. They track different things entirely. They measure the upstream activities and conditions that predict whether an incident will happen, before the incident happens. Those are safety leading indicators, and this guide covers the eight most predictive ones for construction and utility field teams.
The defining characteristic of a leading indicator is timing.
A lagging indicator measures a safety failure after it has occurred. A recordable injury, a lost-workday case, a workers' comp claim.
A leading indicator measures an activity or condition that predicts whether that failure is coming.
The practical difference between leading vs lagging safety indicator matters enormously. When your TRIR rises, you already have injured workers. When your near-miss reporting rate drops or your corrective action close-out time rises, you have a window to intervene. That window is what separates proactive safety programs from reactive ones.
For construction and utility teams specifically, leading indicators need to reflect the reality of field operations with distributed crews, hazardous environments, rotating personnel, and work conditions that change hourly.
Generic corporate safety KPIs often miss that context entirely. The eight indicators below are selected for their predictive strength in exactly these environments, drawing from various research and OSHA's leading indicator framework.
Near-miss reporting is the single most predictive leading indicator available. Every unreported near-miss is a precursor event that didn't trigger a learning response. Organizations with high near-miss reporting rates consistently show lower recordable injury rates because the fewer hazardous events surface and get addressed before they escalate.
A declining near-miss rate is a red flag, not a green one. It usually signals that workers don't trust the reporting system, fear blame, or believe nothing will change.
Track: Weekly
For contractors managing TRIR, near-miss volume is the upstream metric to watch. Download this guide to know the nuances of TRIR.
Safety observations, supervisors or peers formally documenting field conditions and behaviors, serve two functions:
Research consistently links observation frequency to reduced injury rates in field operations.
The quality of observations matters as much as the volume. Observations that only document compliance (everyone wearing PPE) are less valuable than those that identify at-risk conditions or behaviors with specific corrective actions attached.
Track: weekly
ABC's 2026 Health and Safety Performance Report found that companies conducting daily toolbox talks reported lower incident rates than firms holding monthly meetings, making frequency a measurable variable.
The completion rate tracks whether pre-shift safety briefings are actually happening, documented, and tied to the specific hazards of that day's work.
For utility and storm restoration teams, toolbox talks are also an OSHA documentation requirement during restoration events. A digital record of every briefing is increasingly what separates organizations that defend investigations successfully from those that don't.
Track: Daily
See our guide on storm response safety checklists for a practical framework.
Identifying hazards is only half the job. Organizations that identify hazards but don't close corrective actions create a specific failure mode: workers observe that reported problems go unaddressed, near-miss reporting drops, and hazards persist until they produce an incident. Close-out rate measures whether the safety system is actually working after the observation is made.
A close-out rate below 80% within 30 days is a reliable warning sign that safety culture is eroding regardless of what lagging indicators currently show. KYRO AI's field safety module tracks open corrective actions automatically, flagging overdue items to supervisors in real time.
Track: Bi-weekly
Job Hazard Analysis completion before high-risk tasks is one of the most directly protective leading indicators available. For utility linework, trenching, aerial operations, and confined space entry, a completed JHA forces a structured hazard review before work begins.
Research from the Campbell Institute identifies pre-task planning as among the highest-leverage safety activities for field crews.
Track: Daily for high-risk tasks
Training completion isn't just a compliance check. It's a leading indicator with direct predictive power. Tracking and reviewing activities such as safety training, new hire safety orientation, and substance abuse prevention leads to a 59% reduction in TRIR and a 60% reduction in DART rates.
For contractors managing rotating field crews, training completion tracking requires automated credential and certification tracking, not a spreadsheet. Gaps in training coverage across a 200-person deployment create liability exposure that surfaces during OSHA investigations, not before them.
Track: Monthly + at mobilization
See how real-time field data accuracy connects to safety compliance.
Visible safety leadership is one of the strongest predictors of safety culture. And safety culture is one of the strongest predictors of incident rates. When supervisors and project managers regularly conduct documented safety walks, it signals that safety performance is monitored and valued at every level of the organization, not just on paper.
The key word is "documented." Informal walkthroughs that produce no record don't generate the leading indicator data that helps you identify patterns, benchmark performance, or defend your program during an incident investigation.
Track: Weekly
Stop-work authority (SWA) is the right of any worker to halt operations when they observe an unsafe condition. Most safety programs include SWA on paper. Far fewer measure whether it's being used, and a usage rate near zero is not a good sign. It typically means workers don't believe they can exercise SWA without consequences, which is a leading indicator of suppressed near-miss reporting and elevated incident risk.
For utility contractors under OSHA 29 CFR 1910.269, documented SWA usage is increasingly examined during incident investigations.
Track: Monthly
See our full breakdown of what OSHA actually requires during high-risk field operations.
Important caveat on benchmarks: These thresholds reflect field programs across construction and utility operations. Near-miss reporting rate benchmarks are intentionally higher than many organizations currently achieve, because low reporting is the problem, not the benchmark. Use these as directional targets, not pass/fail tests.
The reason many safety programs still rely on lagging indicators isn't philosophical; it's practical. Leading indicators require data that originates in the field: completed forms, timestamped briefings, GPS-verified crew locations, digital sign-offs. When that data lives on paper, in binders, or in supervisor memory, it's unavailable until someone manually collects and compiles it, which typically happens quarterly, if at all.
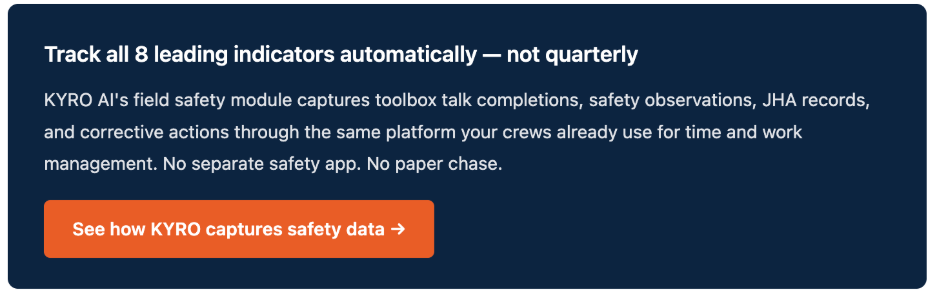
Digital field capture changes the fundamental timing problem. When toolbox talks are completed through KYRO AI's field safety module, the completion rate updates in real time. When a supervisor submits a safety observation, it automatically populates the corrective action tracker. When a worker's training certification expires, the rostering system flags it before that worker is assigned to a high-risk task.
The result is a leading indicator dashboard that reflects current field conditions, not last quarter's paper audit.
For contractors managing large-scale deployments across multiple zones, this shift from quarterly reporting to real-time visibility is often the difference between identifying a safety trend in time to act and identifying it in an incident investigation report.
Proactive metrics that measure activities and conditions predictive of future incidents — near-miss rates, training completion, and inspection frequency. Unlike lagging indicators (TRIR, DART) which measure what already happened, leading indicators give safety managers early warning signals while there is still time to intervene.
Lagging indicators measure safety failures after they occur. Leading indicators measure upstream activities and conditions that predict whether failures will occur. Leading indicators give you time to act; lagging indicators confirm you didn't.
For a full breakdown, see our leading vs. lagging indicators guide.
The 8 strongest for field teams: near-miss reporting rate, safety observation frequency, toolbox talk completion, corrective action close-out rate, JHA completion, training completion, leadership safety walk frequency, and stop-work authority usage rate.

Rabiya Farheen is a content strategist and a writer who loves turning complex ideas into clear, meaningful stories, especially in the world of utility, tech, AI, and B2B SaaS. She works closely with growing teams to create content that doesn’t just check SEO boxes, but actually helps people understand what a product does and why it matters. With a knack for research and a curiosity that never quits, Rabiya dives deep into industry trends, customer pain points, and data to craft content that feels super helpful and informative. When she’s not writing, she’s probably reading, painting, and exploring her creative side— or you'll find her hustling around for social causes, especially those that empower girls and women.
.jpg)
.jpg)
.jpg)