
What Is a Good TRIR? 2025 Guidance Using 2024 Industry Benchmarks

May 18, 2026
3 min read

A good Total Recordable Incident Rate (TRIR) is one that falls below your industry's average. The 2024 national average for all private industry is 2.3 recordable incidents per 100 full-time equivalent workers, the lowest recorded since 2003, per the U.S. Bureau of Labor Statistics. But that number only means something in context.  

A 2.3 TRIR in oil and gas extraction is four times the sector average. In healthcare, it's below average. In construction, it matches the national benchmark exactly.

Here's what your TRIR actually means, how to calculate it, and what it takes to improve it.

What Is TRIR?

TRIR (Total Recordable Incident Rate) is an OSHA-standardized metric that measures how many recordable workplace injuries and illnesses occur per 100 full-time equivalent workers over a 12-month period. Also called Total Case Incident Rate (TCIR), it's calculated using:

TRIR = (Number of Recordable Incidents × 200,000) ÷ Total Hours Worked

The 200,000 constant represents 100 employees × 40 hours/week × 50 weeks. It normalizes your incident count, so a 10-person crew and a 10,000-person workforce can be compared on equal footing.

A work-related injury or illness is OSHA-recordable if it results in death, loss of consciousness, days away from work, restricted work activity, job transfer, medical treatment beyond first aid, or a significant diagnosis by a licensed healthcare professional. First-aid-only cases, basic wound cleaning, non-prescription medications, simple elastic wraps, are not recordable.
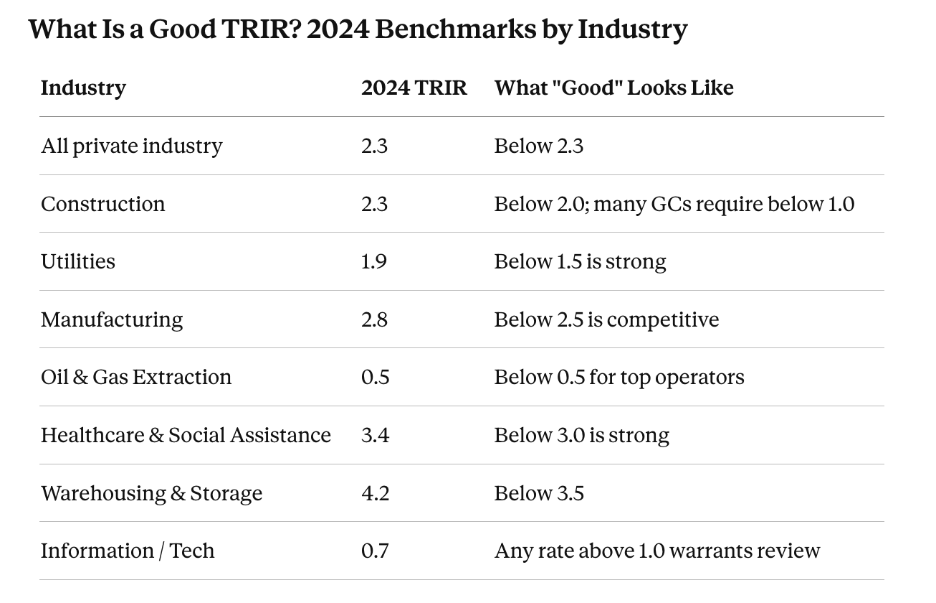
What Is a Good TRIR? 2025 Guidance Based on the Latest 2024 Industry Benchmarks

A good TRIR metric by industry benchmark – Source: BLS Survey of Occupational Injuries and Illnesses 2024, published January 22, 2026.

The perfect TRIR is 0. Below 1.0 is considered excellent in most sectors. Construction Industry Institute (CII) member organizations, the safety elite of the construction industry, achieved an average TRIR of 0.27 in 2024, 88% below the BLS average.

Critically, prequalification platforms like ISNetworld apply stricter thresholds than the BLS average. Most general contractors require TRIR below 2.0. High-hazard project owners, refineries, chemical plants, require below 1.0. These platforms evaluate your rolling three-year average, meaning one bad year affects your bid eligibility for three full bid cycles.

TRIR vs. DART Rate: Know the Difference

DART rate (Days Away, Restricted, or Transferred) counts only severe recordable incidents — those resulting in days away from work, restricted duty, or job transfer. TRIR counts everything. DART is always equal to or less than TRIR.

The 2024 national DART average is 1.4 per 100 FTE workers.

The gap between your TRIR and DART tells you something important. If your TRIR is 3.0 and your DART is 2.8, almost every recordable incident is causing real work disruption. If your TRIR is 3.0 and your DART is 0.6, most incidents are minor, a very different risk profile.  

Watch the trend: if TRIR is declining but DART is flat, you're eliminating minor incidents while failing to address the underlying hazards causing serious ones.

What TRIR Doesn't Tell You

TRIR is a lagging indicator. It reflects what already happened.  

Three limitations every safety professional should know:

1. It doesn't capture severity. Two companies with identical TRIRs can face completely different risk profiles. One's incidents may be minor lacerations. Another's may include near-fatalities documented as restricted work cases. TRIR treats both identically.

2. It doesn't count near misses. Near misses outnumber recordable incidents at a ratio of hundreds-to-one. They don't appear in TRIR at all. Yet they're the most important leading signal that a recordable incident is coming.

3. It's statistically unreliable for small companies. TRIR is only predictive of future safety performance when over 100 months of data are evaluated. A 10-person company that has one incident calculates a TRIR of 9.6, nine times the industry average, from a single event. This is math, not evidence of a dangerous operation.

How TRIR Affects Your Business

Beyond OSHA compliance, your TRIR has direct business consequences:

  • Insurance premiums: Insurers use TRIR to assess risk. A sustained high TRIR leads to higher workers' compensation premiums that compound over years.
  • Contract eligibility: A TRIR above a client's threshold means your bid is rejected before anyone reads your scope of work. One bad year becomes three to five years of restricted bid eligibility through rolling average calculations.
  • Talent: OSHA incident data is now publicly accessible under the expanded 2024 electronic reporting rule (29 CFR 1904.41). Experienced workers research companies before accepting positions. A high TRIR is a recruitment liability.

How to Lower Your TRIR

Reducing TRIR requires upstream work. Changing what happens before incidents occur, not just responding better when they do.

  • Build a near-miss reporting culture. Organizations tracking leading indicators achieve 59% lower TRIR than those relying solely on lagging metrics. Create a non-punitive system, close corrective actions visibly, and set volume targets.
  • Investigate root causes, every time. Retrained the worker?  That addresses the immediate cause. Use 5 Whys or fault tree analysis to find the system failure underneath. Corrective actions that change the system produce lasting TRIR reduction.

The 5 whys / Fault tree analysis

  • Run job hazard analyses before high-risk work. JHAs before non-routine or first-time tasks directly reduce the exposure that drives recordable incidents.
  • Prioritize overexertion controls. Overexertion, lifting, pushing, and pulling are the #1 causes of serious workplace injuries per the 2025 Liberty Mutual Workplace Safety Index. Ergonomic redesign, task rotation, and mechanical assists offer some of the highest TRIR-reduction ROI of any intervention.
  • Make leadership engagement non-negotiable. Weekly supervisor safety walks, safety topics in every standup, and TRIR/DART dashboards visible to leadership, not just EHS teams are the culture inputs that move the metric.

The Bottom Line

A good TRIR is below your industry's BLS average. And ideally below 1.0 if you operate in construction, utilities, or field services where prequalification thresholds are strict. Use the benchmark table above as your reference, pair TRIR with DART rate and leading indicators for a complete picture, and treat the number as a scorecard, not a safety program.

The companies that achieve and sustain low TRIR just don't manage the metrics. They build systems that make recordable incidents rare.

Read this article to know more on the difference of TRIR vs DART

What Is a Good TRIR? 2025 Guidance Using 2024 Industry Benchmarks

May 18, 2026
3 min read
May 25, 2026
Rabiya Farheen
Content Strategist
Author
Rabiya Farheen
Content Strategist

A good Total Recordable Incident Rate (TRIR) is one that falls below your industry's average. The 2024 national average for all private industry is 2.3 recordable incidents per 100 full-time equivalent workers, the lowest recorded since 2003, per the U.S. Bureau of Labor Statistics. But that number only means something in context.  

A 2.3 TRIR in oil and gas extraction is four times the sector average. In healthcare, it's below average. In construction, it matches the national benchmark exactly.

Here's what your TRIR actually means, how to calculate it, and what it takes to improve it.

What Is TRIR?

TRIR (Total Recordable Incident Rate) is an OSHA-standardized metric that measures how many recordable workplace injuries and illnesses occur per 100 full-time equivalent workers over a 12-month period. Also called Total Case Incident Rate (TCIR), it's calculated using:

TRIR = (Number of Recordable Incidents × 200,000) ÷ Total Hours Worked

The 200,000 constant represents 100 employees × 40 hours/week × 50 weeks. It normalizes your incident count, so a 10-person crew and a 10,000-person workforce can be compared on equal footing.

A work-related injury or illness is OSHA-recordable if it results in death, loss of consciousness, days away from work, restricted work activity, job transfer, medical treatment beyond first aid, or a significant diagnosis by a licensed healthcare professional. First-aid-only cases, basic wound cleaning, non-prescription medications, simple elastic wraps, are not recordable.

What Is a Good TRIR? 2025 Guidance Based on the Latest 2024 Industry Benchmarks

A good TRIR metric by industry benchmark – Source: BLS Survey of Occupational Injuries and Illnesses 2024, published January 22, 2026.

The perfect TRIR is 0. Below 1.0 is considered excellent in most sectors. Construction Industry Institute (CII) member organizations, the safety elite of the construction industry, achieved an average TRIR of 0.27 in 2024, 88% below the BLS average.

Critically, prequalification platforms like ISNetworld apply stricter thresholds than the BLS average. Most general contractors require TRIR below 2.0. High-hazard project owners, refineries, chemical plants, require below 1.0. These platforms evaluate your rolling three-year average, meaning one bad year affects your bid eligibility for three full bid cycles.

TRIR vs. DART Rate: Know the Difference

DART rate (Days Away, Restricted, or Transferred) counts only severe recordable incidents — those resulting in days away from work, restricted duty, or job transfer. TRIR counts everything. DART is always equal to or less than TRIR.

The 2024 national DART average is 1.4 per 100 FTE workers.

The gap between your TRIR and DART tells you something important. If your TRIR is 3.0 and your DART is 2.8, almost every recordable incident is causing real work disruption. If your TRIR is 3.0 and your DART is 0.6, most incidents are minor, a very different risk profile.  

Watch the trend: if TRIR is declining but DART is flat, you're eliminating minor incidents while failing to address the underlying hazards causing serious ones.

What TRIR Doesn't Tell You

TRIR is a lagging indicator. It reflects what already happened.  

Three limitations every safety professional should know:

1. It doesn't capture severity. Two companies with identical TRIRs can face completely different risk profiles. One's incidents may be minor lacerations. Another's may include near-fatalities documented as restricted work cases. TRIR treats both identically.

2. It doesn't count near misses. Near misses outnumber recordable incidents at a ratio of hundreds-to-one. They don't appear in TRIR at all. Yet they're the most important leading signal that a recordable incident is coming.

3. It's statistically unreliable for small companies. TRIR is only predictive of future safety performance when over 100 months of data are evaluated. A 10-person company that has one incident calculates a TRIR of 9.6, nine times the industry average, from a single event. This is math, not evidence of a dangerous operation.

How TRIR Affects Your Business

Beyond OSHA compliance, your TRIR has direct business consequences:

  • Insurance premiums: Insurers use TRIR to assess risk. A sustained high TRIR leads to higher workers' compensation premiums that compound over years.
  • Contract eligibility: A TRIR above a client's threshold means your bid is rejected before anyone reads your scope of work. One bad year becomes three to five years of restricted bid eligibility through rolling average calculations.
  • Talent: OSHA incident data is now publicly accessible under the expanded 2024 electronic reporting rule (29 CFR 1904.41). Experienced workers research companies before accepting positions. A high TRIR is a recruitment liability.

How to Lower Your TRIR

Reducing TRIR requires upstream work. Changing what happens before incidents occur, not just responding better when they do.

  • Build a near-miss reporting culture. Organizations tracking leading indicators achieve 59% lower TRIR than those relying solely on lagging metrics. Create a non-punitive system, close corrective actions visibly, and set volume targets.
  • Investigate root causes, every time. Retrained the worker?  That addresses the immediate cause. Use 5 Whys or fault tree analysis to find the system failure underneath. Corrective actions that change the system produce lasting TRIR reduction.

The 5 whys / Fault tree analysis

  • Run job hazard analyses before high-risk work. JHAs before non-routine or first-time tasks directly reduce the exposure that drives recordable incidents.
  • Prioritize overexertion controls. Overexertion, lifting, pushing, and pulling are the #1 causes of serious workplace injuries per the 2025 Liberty Mutual Workplace Safety Index. Ergonomic redesign, task rotation, and mechanical assists offer some of the highest TRIR-reduction ROI of any intervention.
  • Make leadership engagement non-negotiable. Weekly supervisor safety walks, safety topics in every standup, and TRIR/DART dashboards visible to leadership, not just EHS teams are the culture inputs that move the metric.

The Bottom Line

A good TRIR is below your industry's BLS average. And ideally below 1.0 if you operate in construction, utilities, or field services where prequalification thresholds are strict. Use the benchmark table above as your reference, pair TRIR with DART rate and leading indicators for a complete picture, and treat the number as a scorecard, not a safety program.

The companies that achieve and sustain low TRIR just don't manage the metrics. They build systems that make recordable incidents rare.

Read this article to know more on the difference of TRIR vs DART

Rabiya Farheen
Content Strategist

Rabiya Farheen is a content strategist and a writer who loves turning complex ideas into clear, meaningful stories, especially in the world of utility, tech, AI, and B2B SaaS. She works closely with growing teams to create content that doesn’t just check SEO boxes, but actually helps people understand what a product does and why it matters. With a knack for research and a curiosity that never quits, Rabiya dives deep into industry trends, customer pain points, and data to craft content that feels super helpful and informative. When she’s not writing, she’s probably reading, painting, and exploring her creative side— or you'll find her hustling around for social causes, especially those that empower girls and women.

Discover more related blogs.