
.jpg)
TRIR counts every OSHA-recordable injury and illness. DART counts only the ones severe enough to cause days away from work, restricted duty, or a job transfer.
In 2024, the national average TRIR was 2.3, and the national average DART rate was 1.4 per 100 full-time equivalent workers. Meaning roughly 4 in 10 recordable incidents were serious enough to disrupt work. (BLS Survey of Occupational Injuries and Illnesses, published January 2026.)
If you only track one of these, you're missing half the picture. TRIR tells you how often incidents happen. DART tells you how bad they are when they do.

TRIR (Total Recordable Incident Rate) measures how many OSHA-recordable injuries and illnesses occur per 100 full-time equivalent workers over a 12-month period. The formula is:
TRIR = (Number of Recordable Incidents × 200,000) ÷ Total Hours Worked
The 200,000 constant represents 100 employees × 40 hours/week × 50 weeks — it normalizes the rate, so companies of any size can be compared on the same scale.
A case is OSHA-recordable if it results in death, loss of consciousness, days away from work, restricted work activity, job transfer, medical treatment beyond first aid, or a significant diagnosis by a licensed healthcare professional. TRIR captures the full spectrum. From a minor laceration requiring stitches to a serious fracture causing months off work.
DART (Days Away, Restricted, or Transferred) counts only cases severe enough to affect an employee's work status. Meaning they missed work, worked in a restricted capacity, or were transferred to a different role. First-aid cases and medical treatment cases that don't affect work status are excluded.
DART rate = (DART incidents × 200,000) ÷ Total Hours Worked
Because DART is a subset of TRIR, it is always equal to or lower than TRIR.
A company that recorded 10 total incidents with 6 resulting in days away or restriction would have a TRIR reflecting all 10 and a DART reflecting only those 6.
The Core Difference
The simplest way to think about it:
A company with a TRIR of 4.0 and a DART of 0.8 is having many recordables, but most are minor. Like a physician visit, a prescription, no lost time.
A company with a TRIR of 2.0 and a DART of 1.8 has fewer incidents overall, but nearly all of them are causing real work disruption.
These are fundamentally different safety problems that require different interventions.
Just like TRIR, a "good" DART rate is relative to your sector. The 2024 BLS data shows significant variation:
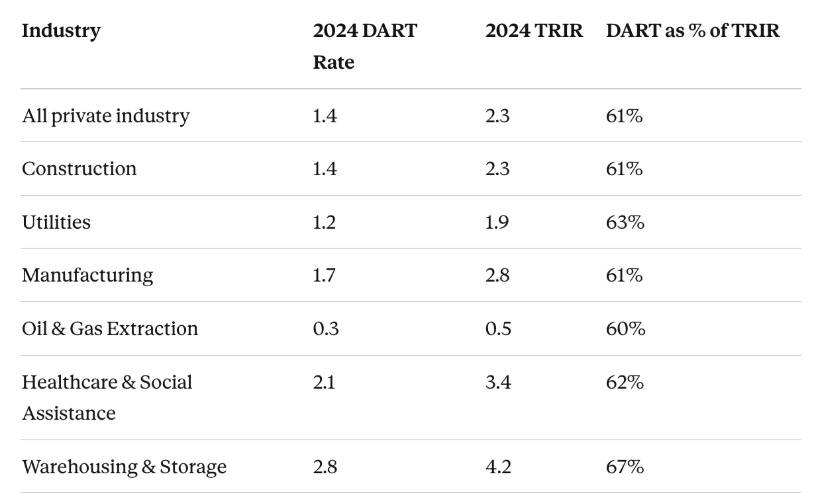
DART figures are estimated from published case type distributions.
One pattern stands out: across most industries, DART accounts for roughly 60–65% of TRIR.
If your DART-to-TRIR ratio is significantly higher than 65%, your incidents are skewing more severely than the sector norm — a signal worth investigating regardless of where your absolute TRIR sits.
Use TRIR when you need to measure overall recordable injury frequency. It's the standard metric for:
Use DART when you want to understand the operational and human cost of incidents. Because it focuses on cases that affect work status, it's especially useful for:
The most useful insight comes from tracking both side by side and reading the gap between them.
High TRIR, low DART: Many minor recordables. The organization is having frequent incidents, but most don't disrupt work.
Priorities: behavior-based hazard controls, housekeeping, training on first-aid-boundary cases.
Low TRIR, high DART: Few incidents but they're serious. Every recordable is causing real disruption.
Priorities: root cause investigation, engineering controls on high-severity tasks, supervision quality.
High TRIR, high DART: Broad safety system failure. Both frequency and severity are elevated. Requires a full safety program review for leadership commitment, hazard identification, and investigation of quality.
Both declining: Your safety program is working. Continue current strategies and benchmark quarterly.
Watch the trend, not just the snapshot. If TRIR is declining but DART is flat or rising, your program may be eliminating minor incidents while failing to address the underlying exposures driving serious ones.
For contractors, TRIR and DART are not just internal management tools. They're business credentials. Most general contractors and owner-operators review both when selecting vendors:
Pre-qualification platforms typically use a rolling three-year average for both metrics. One bad year affects your score for three bid cycles. Manage both numbers proactively, not reactively.
TRIR and DART answer different safety questions. TRIR tells you how many recordable incidents occurred; DART tells you how many of those incidents were serious enough to disrupt work. In 2024 alone, roughly 61% of all private industry recordable incidents crossed the DART threshold, meaning nearly 4 in 10 recordables did not result in lost time or restriction.
Use both metrics together, watch the gap between them, and treat any divergence in trend as a signal worth investigating.
Read more: → Leading vs. Lagging Safety Indicators
Is DART always lower than TRIR?
Yes. DART is a subset of OSHA-recordable cases, so it can never exceed TRIR. If your DART equals your TRIR, every recordable incident resulted in days away, restricted duty, or transfer — an unusual pattern worth investigating.
Which metric is more important?
Neither is more important in isolation. TRIR shows total incident frequency; DART shows severity and work disruption. Safety programs that track only one are missing information the other provides.
What is the national DART average for 2024?
The 2024 national average DART rate for all private industry is 1.4 per 100 full-time equivalent workers, per the BLS Survey of Occupational Injuries and Illnesses published January 2026.
Should small companies track both?
Yes — but small companies should be cautious about overinterpreting short-term swings in either metric. A single incident on a small crew can spike both TRIR and DART dramatically due to the math of low exposure hours. Track trends over rolling 12-month periods rather than reacting to individual data points.
What's the difference between DART and DAFW?
DAFW (Days Away from Work) is a subset of DART — it counts only cases involving actual lost workdays, excluding restricted duty and job transfers. DAFW is the most direct measure of lost productivity and is often used as a severity proxy alongside DART.

TRIR counts every OSHA-recordable injury and illness. DART counts only the ones severe enough to cause days away from work, restricted duty, or a job transfer.
In 2024, the national average TRIR was 2.3, and the national average DART rate was 1.4 per 100 full-time equivalent workers. Meaning roughly 4 in 10 recordable incidents were serious enough to disrupt work. (BLS Survey of Occupational Injuries and Illnesses, published January 2026.)
If you only track one of these, you're missing half the picture. TRIR tells you how often incidents happen. DART tells you how bad they are when they do.

TRIR (Total Recordable Incident Rate) measures how many OSHA-recordable injuries and illnesses occur per 100 full-time equivalent workers over a 12-month period. The formula is:
TRIR = (Number of Recordable Incidents × 200,000) ÷ Total Hours Worked
The 200,000 constant represents 100 employees × 40 hours/week × 50 weeks — it normalizes the rate, so companies of any size can be compared on the same scale.
A case is OSHA-recordable if it results in death, loss of consciousness, days away from work, restricted work activity, job transfer, medical treatment beyond first aid, or a significant diagnosis by a licensed healthcare professional. TRIR captures the full spectrum. From a minor laceration requiring stitches to a serious fracture causing months off work.
DART (Days Away, Restricted, or Transferred) counts only cases severe enough to affect an employee's work status. Meaning they missed work, worked in a restricted capacity, or were transferred to a different role. First-aid cases and medical treatment cases that don't affect work status are excluded.
DART rate = (DART incidents × 200,000) ÷ Total Hours Worked
Because DART is a subset of TRIR, it is always equal to or lower than TRIR.
A company that recorded 10 total incidents with 6 resulting in days away or restriction would have a TRIR reflecting all 10 and a DART reflecting only those 6.
The Core Difference
The simplest way to think about it:
A company with a TRIR of 4.0 and a DART of 0.8 is having many recordables, but most are minor. Like a physician visit, a prescription, no lost time.
A company with a TRIR of 2.0 and a DART of 1.8 has fewer incidents overall, but nearly all of them are causing real work disruption.
These are fundamentally different safety problems that require different interventions.
Just like TRIR, a "good" DART rate is relative to your sector. The 2024 BLS data shows significant variation:

DART figures are estimated from published case type distributions.
One pattern stands out: across most industries, DART accounts for roughly 60–65% of TRIR.
If your DART-to-TRIR ratio is significantly higher than 65%, your incidents are skewing more severely than the sector norm — a signal worth investigating regardless of where your absolute TRIR sits.
Use TRIR when you need to measure overall recordable injury frequency. It's the standard metric for:
Use DART when you want to understand the operational and human cost of incidents. Because it focuses on cases that affect work status, it's especially useful for:
The most useful insight comes from tracking both side by side and reading the gap between them.
High TRIR, low DART: Many minor recordables. The organization is having frequent incidents, but most don't disrupt work.
Priorities: behavior-based hazard controls, housekeeping, training on first-aid-boundary cases.
Low TRIR, high DART: Few incidents but they're serious. Every recordable is causing real disruption.
Priorities: root cause investigation, engineering controls on high-severity tasks, supervision quality.
High TRIR, high DART: Broad safety system failure. Both frequency and severity are elevated. Requires a full safety program review for leadership commitment, hazard identification, and investigation of quality.
Both declining: Your safety program is working. Continue current strategies and benchmark quarterly.
Watch the trend, not just the snapshot. If TRIR is declining but DART is flat or rising, your program may be eliminating minor incidents while failing to address the underlying exposures driving serious ones.
For contractors, TRIR and DART are not just internal management tools. They're business credentials. Most general contractors and owner-operators review both when selecting vendors:
Pre-qualification platforms typically use a rolling three-year average for both metrics. One bad year affects your score for three bid cycles. Manage both numbers proactively, not reactively.
TRIR and DART answer different safety questions. TRIR tells you how many recordable incidents occurred; DART tells you how many of those incidents were serious enough to disrupt work. In 2024 alone, roughly 61% of all private industry recordable incidents crossed the DART threshold, meaning nearly 4 in 10 recordables did not result in lost time or restriction.
Use both metrics together, watch the gap between them, and treat any divergence in trend as a signal worth investigating.
Read more: → Leading vs. Lagging Safety Indicators
Is DART always lower than TRIR?
Yes. DART is a subset of OSHA-recordable cases, so it can never exceed TRIR. If your DART equals your TRIR, every recordable incident resulted in days away, restricted duty, or transfer — an unusual pattern worth investigating.
Which metric is more important?
Neither is more important in isolation. TRIR shows total incident frequency; DART shows severity and work disruption. Safety programs that track only one are missing information the other provides.
What is the national DART average for 2024?
The 2024 national average DART rate for all private industry is 1.4 per 100 full-time equivalent workers, per the BLS Survey of Occupational Injuries and Illnesses published January 2026.
Should small companies track both?
Yes — but small companies should be cautious about overinterpreting short-term swings in either metric. A single incident on a small crew can spike both TRIR and DART dramatically due to the math of low exposure hours. Track trends over rolling 12-month periods rather than reacting to individual data points.
What's the difference between DART and DAFW?
DAFW (Days Away from Work) is a subset of DART — it counts only cases involving actual lost workdays, excluding restricted duty and job transfers. DAFW is the most direct measure of lost productivity and is often used as a severity proxy alongside DART.

Rabiya Farheen is a content strategist and a writer who loves turning complex ideas into clear, meaningful stories, especially in the world of utility, tech, AI, and B2B SaaS. She works closely with growing teams to create content that doesn’t just check SEO boxes, but actually helps people understand what a product does and why it matters. With a knack for research and a curiosity that never quits, Rabiya dives deep into industry trends, customer pain points, and data to craft content that feels super helpful and informative. When she’s not writing, she’s probably reading, painting, and exploring her creative side— or you'll find her hustling around for social causes, especially those that empower girls and women.