

Features
Industries
Who we serve
Resources
Sign in
Get Started - $500/month
No commitment. No implementation fee. Unlimited users. Cancel anytime
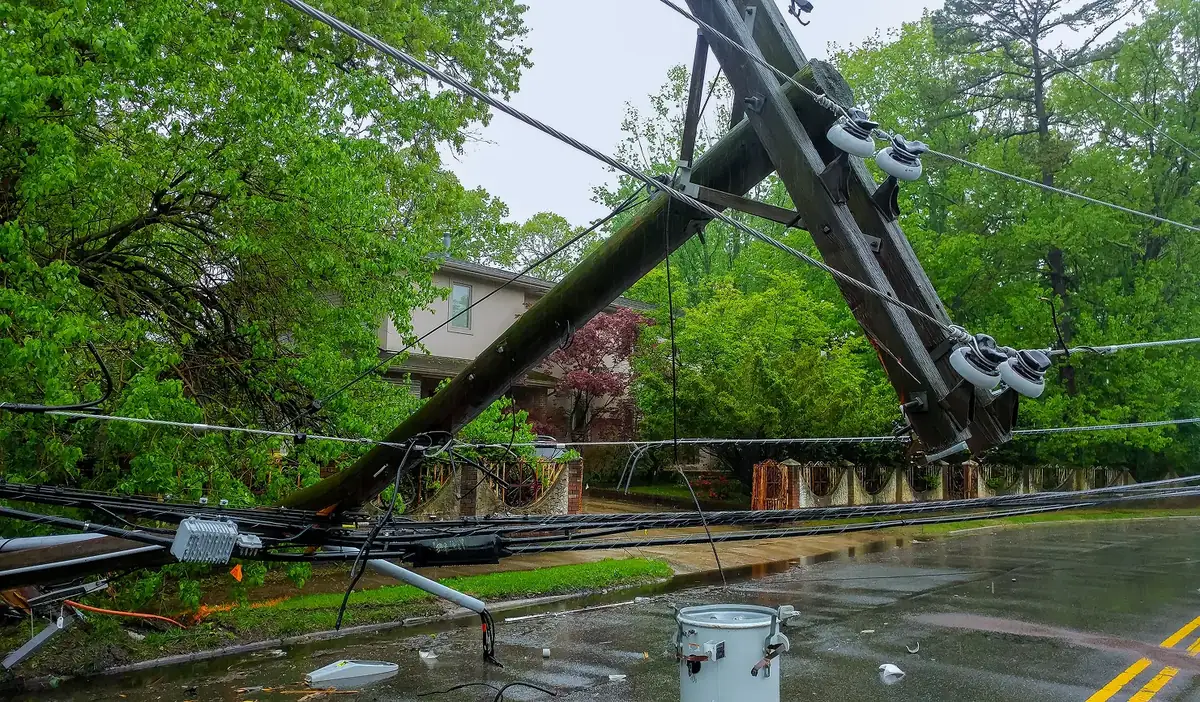
U.S. electricity customers lost power for an average of 11 hours in 2024, nearly double the prior decade’s annual average. Three storms, Beryl, Helene, and Milton, accounted for 80% of every hour customers spent in the dark that year, according to the U.S. Energy Information Administration. Behind each of those hours sits a storm manager working a phone and a whiteboard, plus half a dozen disconnected systems, trying to answer three questions at once: where are the crews, what’s still broken, who needs to be told next.
Search for a single resource that walks through the full utility storm response process, from readiness planning through the post-storm report to the state commission, and you won’t find much. What exists is scattered: a mutual assistance overview here, a NERC reliability standard there, a restoration priority chart buried in a PDF nobody outside the emergency operations center has opened. Storm managers end up piecing the process together from memory, tribal knowledge passed down from the last major event, and whatever their outage management vendor happened to document.
That gap is the reason this guide exists. It covers the full utility storm response lifecycle, from year-round readiness through mutual assistance, damage assessment, active restoration, communication, and the post-storm review that determines whether next year goes better or worse. The point of view running through it is simple: storm response is not a collection of field activities that happen to occur in sequence during bad weather. It’s an operational system, and utilities that manage it as a system consistently restore power faster and account for their spending better than ones that manage it as a string of tasks.
Most storm response training still gets delivered department by department. Vegetation management learns its part. Dispatch learns its part. Communications learns its part. Nobody outside senior leadership is trained on how those parts hand off to each other, so the handoffs get invented on the fly, differently, at every utility, every storm season. This guide is written for the storm manager and the VP of Operations who have to own that handoff, not just their own piece of it.
Weather, excluding lightning, was the single largest cause of Bulk Electric System outages in 2024, affecting more than six times the megavolt-ampere capacity of any other cause tracked, and it held that position in every interconnection across the country, according to NERC’s 2025 State of Reliability Technical Assessment. That is not a regional anomaly. About 80% of major U.S. power outages between 2000 and 2023 were caused by weather events, according to Climate Central’s analysis of DOE OE-417 data.
The trend is accelerating, not leveling off. Interruptions during major weather events averaged nearly 9 hours per customer in 2024, compared to roughly 4 hours per year across the prior decade, and South Carolina posted the longest average outage duration in the country at nearly 53 hours, per the EIA. J.D. Power found that the average length of the longest outage per customer climbed from 8.1 hours in 2022 to 12.8 hours by the middle of 2025, with Southern customers averaging 18.2 hours and Southern outages tied specifically to extreme weather stretching to 95.2 hours on average, reported by Utility Dive. Nearly half of U.S. utility customers experienced an outage in the first half of 2025 alone, and 77% of Southern customers who lost power did so following an extreme weather event.
Vegetation compounds the problem in a way that’s easy to underestimate outside storm season. Trees and limbs account for roughly 20% to 23% of U.S. distribution outages in an average year, according to a Utility Vegetation Management industry survey cited by T&D World, but in heavily forested regions like New England, vegetation can cause more than 90% of outages during an actual storm, according to Eversource. A utility that treats vegetation management as a separate line item from storm planning, rather than as the first input into where damage will concentrate, is already working with a blind spot before the first crew rolls out.
None of this is new information to anyone who has worked a storm. What it does is put a number on something crews already know from experience: storms aren’t an occasional disruption to normal grid operations anymore. For a growing share of utilities, they are the operation.
Sustained power interruptions cost the U.S. economy approximately $44 billion a year in 2015 dollars, according to Lawrence Berkeley National Laboratory’s Electricity Markets and Policy Group. That’s a 25% increase over an earlier 2006 study’s estimate once its $26 billion figure, quoted in 2002 dollars, is converted to the same 2015 dollars, the like-for-like comparison LBNL itself uses to show the trend. Commercial customers absorb about 70% of that cost, industrial customers 27%, and residential customers the remaining 3%. Regulators and large commercial customers both watch restoration performance closely because the dollar figure behind a slow restoration is measurable, and Lawrence Berkeley’s Interruption Cost Estimate Calculator, built with the Department of Energy, is the tool most commonly used to put a price on it.
That cost pressure lands on storm managers in a specific way. A commission asking why restoration in one county took three days longer than a neighboring utility’s territory doesn’t want to hear that the damage assessment data was stuck in a paper form until a supervisor drove it back to base. It wants a defensible account of what happened, when, and why. A utility that can’t reconstruct its own restoration timeline in enough detail to answer that question has a bigger problem than a bad PR week: a credibility problem with the body that sets its rates.
Vegetation, mutual aid costs, overtime, and equipment mobilization all add up before a single customer sees their lights come back on. A slow or disorganized restoration doesn’t just extend outage hours, it inflates the cost of the response itself, because crews sit idle waiting for assignments, materials arrive at the wrong staging site, and management burns hours reconciling numbers that should have synced automatically.
The industry’s own restoration process reveals its own logic here, even if most utilities don’t operate as if they’ve internalized it. When a major event hits, restoration follows a documented order: power plants and high-voltage transmission lines and substations get repaired first, because nothing downstream works without them. Next come critical facilities, hospitals, police and fire stations, water treatment plants, and communications infrastructure. Then distribution lines serving the largest number of customers. Individual homes and small customer groups come last, according to EEI’s industry-standard restoration process documentation.
That sequence only works if every stage feeds the next one with accurate information. Damage assessment has to identify which substations are down before crews can be dispatched to fix them. Dispatch needs to know which circuits feed which critical facilities before it can prioritize correctly. And communication teams cannot explain to a mayor’s office, a hospital administrator, or a customer calling in why their neighborhood isn’t first unless they know the actual restoration order themselves. Each stage depends on the one before it. That’s what makes it a system rather than a checklist, and it’s why a break in the chain at any single point, a damage assessment that never reaches dispatch, a crew status update that lives only on a paper log, shows up downstream as a restoration delay that looks like a field problem but started as an information problem.
Utilities that treat readiness, mobilization, assessment, restoration, communication, and review as six separate departments running six separate processes end up rebuilding the connections between them by hand, under pressure, during the worst week of the year. Utilities that build the connections in advance spend the storm executing instead of improvising.
Storm response starts long before a forecast shows a system forming. NERC addresses extreme weather preparedness directly through Reliability Standards EOP-011 and EOP-012, and it issued a Level 3 Alert in May 2023 on cold-weather preparedness, the highest-priority alert category NERC issues, according to NERC’s own alert notice. Those standards exist because cold-weather failures in prior winters exposed gaps that summer-storm planning never touched. When FERC and NERC jointly reported on the Bulk-Power System’s performance during the successive Arctic cold weather events of January 2025, they found the system held up without major issues in either the natural gas or electric systems, a result they credited directly to the cold-weather reliability standard actions taken after those earlier failures, according to the joint FERC/NERC report. Preparedness measures written into standards, and actually followed, changed the outcome of the next event they were written for.
Readiness work includes vegetation management cycles timed against the historical patterns for a given territory, since so much storm damage traces back to trees. Vegetation alone can drive more than 90% of outages during a storm in a heavily forested territory, per Eversource’s vegetation management data, which means a trim cycle that’s fallen behind schedule is not a maintenance backlog so much as a restoration delay that hasn’t happened yet.
Readiness also includes equipment inventory, spare transformers, poles, conductor, staged where they can reach likely damage zones quickly rather than centralized for administrative convenience. It includes standing agreements for outside crews and updated contact trees for emergency operations staff. It also includes a training cycle that puts new hires through a mock activation before their first real one. A mock activation is worth running the same way a fire drill is worth running: not because anyone expects it to go perfectly, but because the gaps it exposes are far cheaper to fix in a tabletop exercise in March than in a live event in August.
The utilities that come out of a bad storm season looking prepared usually aren’t the ones that scrambled hardest during the event. They’re the ones whose readiness work all year made the event itself less chaotic. Readiness isn’t a phase that ends when storm season starts. It’s the baseline the rest of the lifecycle is built on, and it’s the stage most likely to get shortchanged, because unlike active restoration, nobody outside the utility is watching it happen.
Once a storm is tracked and expected to cause significant damage, mobilization begins days ahead of landfall, not hours. This is where mutual assistance becomes the backbone of the entire response for any utility whose own crews can’t cover the damage alone.
The Edison Electric Institute’s mutual assistance program is a voluntary partnership among investor-owned electric companies that lets a utility facing a major outage event temporarily expand its workforce by requesting skilled restoration crews and specialized equipment from unaffected companies elsewhere in the country, per EEI. As power systems have become more interconnected, EEI member companies have organized into Regional Mutual Assistance Groups, standing state and regional partnerships that activate automatically when a member requests help, rather than requiring a utility to build a mutual aid network from scratch mid-event.
Electric cooperatives run a parallel system with deeper roots. Cooperatives have coordinated formal mutual assistance since the 1930s rural electrification era, and today statewide cooperative organizations designate storm coordinators who manage crew and equipment requests across state lines during a disaster, according to NRECA. During Hurricane Helene in September 2024, cooperatives from 18 states sent mutual aid crews into the seven affected states, and one cooperative’s storm basecamp alone housed nearly 1,500 workers, per America’s Electric Cooperatives. Helene knocked out power to 5.9 million customers across 10 states, including 1.2 million in South Carolina by itself. A response at that scale is only possible because the mutual aid framework already existed before the storm made landfall.
The federal government mobilizes in parallel through Emergency Support Function 12, Energy, part of FEMA’s National Response Framework and led by the Department of Energy’s Office of Cybersecurity, Energy Security, and Emergency Response. ESF-12 coordinates federal support to help energy asset owners restore damaged systems. It also gathers and shares outage impact data across agencies, and facilitates emergency legal and regulatory waivers utilities need to move crews and equipment across state lines quickly, per FEMA and DOE CESER. The responders who staff ESF-12 are volunteer DOE federal employees drawn from across the department itself, its national laboratories, and the Power Marketing Administrations. They deploy to State Emergency Operations Centers and FEMA Regional Response Coordination Centers ahead of an approaching storm, not after, according to energy.gov.
Mobilization is the stage where a utility’s forecasting, its mutual aid agreements, and its logistics planning either come together into one coordinated pre-positioning effort or stay siloed until the storm forces them to interact. Crew housing, fuel, staging sites, and equipment all need to be locked down before landfall, and every hour spent negotiating those details after the storm has already hit is an hour restoration doesn’t happen.
Requesting mutual aid isn’t a single phone call. It requires a specific ask, how many line crews, how many tree crews, what equipment, for how long, submitted early enough that the requesting utility isn’t competing with three other affected utilities for the same limited pool of available crews. Utilities that wait until damage is confirmed to start that request lose a full day or more compared to ones that pre-position a conditional request as soon as the forecast track firms up. That timing decision belongs to the same emergency operations team running readiness and assessment, not a separate procurement function working off its own timeline.
Once the storm passes, the first job is finding out what’s actually broken, and the second is deciding what gets fixed first. Both have to happen fast, and both depend on information moving cleanly from the field to whoever is making dispatch decisions.
The restoration priority sequence documented by EEI functions as the operating logic every utility follows during a major event, not a suggestion: power plants, high-voltage transmission, and substations come first, because everything else depends on them; critical facilities, hospitals, police and fire stations, water treatment, and communications infrastructure, come second; distribution lines serving the largest customer counts come third; and individual homes and small groups of customers come last, per EEI’s MA_101 documentation. What varies utility to utility, and storm to storm, is how fast an accurate damage assessment reaches the people applying that priority sequence to real, specific circuits.
Florida Power & Light’s public restoration timeline shows what a disciplined version of this looks like in practice. FPL issues an estimated time of restoration at staged intervals after a storm passes: a systemwide estimate at 24 hours post-landfall, a county-by-county estimate at 48 hours, localized restoration estimates at 96 hours, each one built on the damage assessment findings and available resources at that point in time, per FPL. That staged approach exists because damage assessment doesn’t finish in a single pass. It refines over the first four days, and restoration estimates have to refine with it or they stop being credible.
The practical bottleneck at this stage is rarely the assessment itself. Crews can drive circuits and spot damage quickly. The bottleneck is getting that damage data out of a truck, a radio call, or a paper form and into whatever system is deciding dispatch priority, in a form specific enough to act on. A damage report that says “lines down near Route 9” is nearly useless for prioritization against the sequence above. A damage report tied to a specific circuit, a specific structure type, and a specific customer count behind it is what turns the priority sequence from a policy document into an actual dispatch order.
This is the stage most people picture when they think about storm response: bucket trucks, downed lines, crews working circuits in whatever order the priority sequence and the damage assessment point them toward. It’s also the stage where mutual aid crews from out of state or out of territory need to be brought up to speed fast, on unfamiliar circuits, unfamiliar equipment standards, and an unfamiliar chain of command.
Coordinating a mixed workforce of home crews, contract crews, and mutual aid crews from a dozen different companies is a logistics problem as much as a restoration problem. Crew assignments have to route around each other rather than duplicating work on the same circuit. Safety tagging and clearance procedures have to be understood the same way by every crew on site, regardless of which utility they came from. Materials have to reach the right staging point before a crew arrives there, not after. None of that runs on good intentions. It runs on a shared, current picture of what’s assigned, what’s completed, what’s still open, visible to the incident commander and every crew lead at the same time.
The scale question matters here too. Helene’s mutual aid response involved cooperative crews from 18 states working alongside investor-owned utility crews mobilized through EEI’s regional groups, all converging on the same seven affected states within days of landfall. Coordinating that many outside crews against one utility’s restoration priorities, without losing track of who is where and what’s been completed, is the exact problem that turns a well-planned mobilization into either an efficient restoration or a logistics mess, depending on whether the coordination system can keep up with the number of moving pieces.
Crew coordination is also where fatigue management and safety oversight live, and neither can be managed well without visibility into how long crews have actually been working, not how long they were scheduled to work. A restoration effort that runs crews past safe limits because nobody had a current view of hours worked is a compliance risk and, in practice, a slower restoration overall: tired crews make more mistakes, and rework costs more time than the extra hours saved.
The Incident Command System structure that most utilities adopt for major events, borrowed from the same National Incident Management System framework FEMA uses across all hazard types, exists to solve exactly this problem: one incident commander, clear spans of control, and a defined chain for reporting status up and pushing assignments down. ICS gives the organization a shape, but not, on its own, a shared data feed to fill that shape with. A utility can run textbook ICS and still have its planning section working from information that’s an hour old, because the field-to-command reporting loop is still a radio call and a whiteboard update rather than something that updates automatically as crews close out jobs.
Every stage above generates information that somebody outside the restoration effort needs, and needs accurately. Customers want a restoration estimate they can plan around. State public utility commissions want documentation of what happened and why the response looked the way it did. Local emergency management wants to know when specific critical facilities, the hospital, the water treatment plant, will be back online, because their own emergency response depends on it.
ESF-12’s role in gathering and sharing outage impact data across federal, state, and utility lines exists precisely because storm response isn’t a private matter between a utility and its customers during a declared emergency. It touches state emergency operations centers and FEMA regional coordination, and in some cases legal waivers that let crews and equipment move faster across jurisdictions, per FEMA’s ESF-12 annex. A utility whose internal restoration data can’t be summarized quickly and accurately for that outside audience ends up either delaying the information those partners need, or providing numbers that don’t hold up when checked against what actually happened in the field.
The same discipline applies to customer-facing restoration estimates. FPL’s staged ETR approach, a systemwide number at 24 hours, county-level at 48, localized at 96, works because each estimate is explicitly tied to the damage assessment quality available at that point. Utilities that issue a single early restoration estimate and then have to walk it back repeatedly as better data comes in erode the trust that estimate was supposed to build. Getting the staging right is less a communications tactic than a direct downstream consequence of how well damage assessment and restoration tracking are working further up the chain.
There is no reliable industry-wide figure for how consistently utilities meet state-mandated storm reporting timelines, so it isn’t worth guessing at one here. What’s well established is the structural expectation: state commissions generally require post-storm reporting on restoration performance, and the quality of that reporting depends entirely on whether a utility captured accurate, time-stamped restoration data during the event itself, rather than trying to reconstruct it afterward from memory and scattered logs.
The storm ends when the lights come back on. The lifecycle doesn’t end there. What a utility does in the weeks after restoration determines whether the next storm goes better or repeats the same problems.
IEEE 1782-2022 gives utilities a standardized way to document and categorize outage data, then analyze it, supporting consistent performance measurement not just within one utility’s own history but across companies, according to IEEE. Without a standardized way to categorize what caused an outage, how long each stage of restoration took, and where the biggest delays occurred, a post-storm review turns into a collection of anecdotes rather than a data set that improves next year’s readiness plan.
The economic cost data from Lawrence Berkeley’s research and its ICE Calculator gives utilities a second measurement axis: not just how long restoration took, but what that duration cost customers, broken down by commercial, industrial, and residential impact. Regulators increasingly expect utilities to speak in those terms when justifying storm hardening investment or defending restoration performance after a bad event.
A post-storm review that only asks “how fast did we restore power” misses half the picture. The better question is where the system worked as a system, damage assessment feeding dispatch feeding communication without a gap, and where it broke into disconnected steps that had to be bridged manually under pressure. Those manual bridges are exactly what to fix before the next event, because they’re also the parts of the process nobody has time to fix mid-storm.
Run the review while the details are still fresh, not weeks later once the crews have demobilized and moved on to the next job. A lessons-learned session held within days of restoration, with damage assessment leads, dispatch, communications, and the mutual aid coordinator all in the same room, surfaces the specific handoff points that slowed things down. Held a month out, the same session tends to produce vague agreement that “communication could have been better,” with nobody able to point to the exact moment it broke.
The same failure pattern repeats across utilities of every size. A damage assessment gets logged on paper in the field and doesn’t reach dispatch until a supervisor physically drives it back to base. A crew status update lives in one coordinator’s spreadsheet and never syncs with the incident commander’s board, so two different people are working from two different pictures of who’s assigned where. A customer-facing restoration estimate gets published before the damage assessment behind it has actually stabilized, and then has to be revised twice, each revision costing a little more public trust. A post-storm report gets assembled from memory and scattered logs three weeks after the event, by which point half the detail that would have made it useful is gone.
None of these are field failures. Crews did their jobs. Every one of them is an information failure, a gap between one stage of the lifecycle and the next that had to be closed by hand, usually by someone already stretched thin during the worst week of the year. Multiply that gap across the full lifecycle, and the cumulative effect is a slower, more expensive restoration that looks, from the outside, like bad execution, when the real cause was a process that was never built to connect.
Reliability data backs up what this looks like at scale. Public power utilities are consistently more reliable than investor-owned or cooperative utilities based on EIA data submitted from 2013 through 2024, with the average public power customer losing power for less than half the time of customers served under other ownership models, according to the American Public Power Association. Ownership structure alone doesn’t explain that gap. Operational discipline, the habit of connecting one stage of the response to the next instead of managing each one as its own separate function, is a real factor behind it.
None of the stages above are optional, and none of them work in isolation. A utility can run a technically excellent damage assessment and still deliver a slow restoration if that assessment data sits in a format dispatch can’t use quickly. A utility can mobilize mutual aid crews flawlessly and still lose time if those crews arrive without a shared, current view of assignments and priorities. The connective tissue between stages is what determines whether a well-designed process actually performs under storm conditions, or falls apart the first time three things go wrong at once.
This is the operational gap KYRO AI is built to close: a shared view of crew status, damage assessment, and restoration priority that updates in the field and shows up the same way on the incident commander’s screen, so a change logged by a crew lead on site is the same information the emergency operations center is working from a minute later. It’s a piece of the system, not a replacement for the judgment of the people running it, and it earns its place by removing the manual hand-offs that eat time during exactly the week nobody has time to spare.
Utilities that come out of storm season ahead usually don’t have the biggest crew count or the newest trucks. What they have is a set of lifecycle stages that all draw from the same current picture of what’s happening, instead of half a dozen separate pictures someone has to reconcile by hand after the fact. Building that connected picture before the next storm, not during it, is the work this guide has been describing.
Every utility’s storm response system carries its own history: legacy tools, past events that shaped current procedures, regulatory requirements specific to its state. This guide covers the lifecycle every one of them shares. For the operational detail specific to running a storm event start to finish, crew mobilization checklists, damage assessment field templates, the post-storm reporting structure that holds up under commission review, read KYRO’s Storm Response Playbook alongside our other related storm response guides. It’s built to sit next to this one, not repeat it.


.webp)